


Next: Exercise
Up: processing
Previous: Synthetic Apertur Radar
Main level:
Epsilon Nought - Radar Remote Sensing
Subsections
Figure 3.1:
Imaging geometry of a SAR-system
|
|
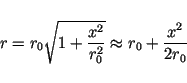
Fig. 3.1 pictures the illumination of a point target by
a SAR sensor during data acquisition. The sensor is moved along the
x-axis (azimuth) and emmits, perpendicular to flight direction, the
radar pulses to the ground. The distance between the sensor at position
 and the target can be expressed as
 |
(8) |
where  denotes the minimum distance between both at
  . As
the extension of the radar footprint on the ground is (usually) much
smaller than the target distance (
. As
the extension of the radar footprint on the ground is (usually) much
smaller than the target distance ( ), the following approximation
can be made:
), the following approximation
can be made:
 |
(9) |
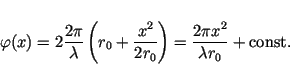
The phases of the received echos, resulting from the two-way distance  ,
are:
,
are:
 |
(10) |
Assuming a constant sensor velocity  and the abbreviation
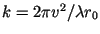 , a quadratic phase behaviour in time is resulting,
neglecting the constant phase term, which has no time dependency.
, a quadratic phase behaviour in time is resulting,
neglecting the constant phase term, which has no time dependency.
 |
(11) |
The quadratic phase behaviour corresponds to a linear change in the received
azimuth frequency  , the so-called DOPPLER-effect.
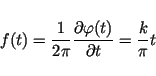 |
(12) |
This linear DOPPLER-effect is only present as long as is really small
in comparison to . Otherwise high order components are occuring and the
correct hyperbolic phase history has to be taken into account. Particularly, this
is the case for SAR sensors with very long apertures and for those operating
not exactly perpendicular to the flight direction but under a so-called
squint-angle.
The maximal illumination time of a point target is defined by the extension of
the antenna footprint in azimuth. This length, equal to the length of the synthetic
aperture, is determined by:
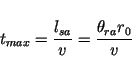 |
(13) |
The bandwidth of the signal in azimuth  is, therefore,
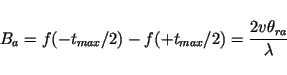 |
(14) |
This bandwidth in azimuth sets also the lower limit of the pulse repetion
frequency (PRF) of the radar, with which the radar pulses are emmitted to the
ground. After eliminating the carrier frequency (demodulation in the receiver
hardware), frequencies between  and
and  are present in the complex
signal. According to the NYQUIST-criterion, a sampling frequency of two
times the maximum frequency is necessary for an unambigous recording of the
data. Here, the sampling frequency is given by the PRF.
are present in the complex
signal. According to the NYQUIST-criterion, a sampling frequency of two
times the maximum frequency is necessary for an unambigous recording of the
data. Here, the sampling frequency is given by the PRF.
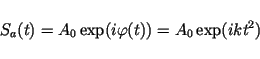
Processing in azimuth
The echo of a single point target is contained in may received radar pulses
and appears therefore defocused. The aim of SAR processing, also called compression,
is to focus all the received energy of a target, distributed over the illumination
time, on one point at  . To achieve this, the typical phase history, coming
from the data acquisition process, is used. Assuming the backscattering of a
point target to be time- and angular-independent, and also dominant to other signals
like noise and background reflections, the received signal in azimuth direction
can be written as
. To achieve this, the typical phase history, coming
from the data acquisition process, is used. Assuming the backscattering of a
point target to be time- and angular-independent, and also dominant to other signals
like noise and background reflections, the received signal in azimuth direction
can be written as
 |
(15) |
with  denoting the backscattering amplitude of a point target (a complex value).
The idea of azimuth compression is now to adjust all these phase value to the
same value, followed by a coherent summation. To achieve this, a correlation
of
denoting the backscattering amplitude of a point target (a complex value).
The idea of azimuth compression is now to adjust all these phase value to the
same value, followed by a coherent summation. To achieve this, a correlation
of  with a reference function
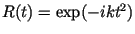 is performed. This reference
function is constructed in a way that it has in every point exactly the opposite phase
of the ideal impulse response in Eq.3.8.
is performed. This reference
function is constructed in a way that it has in every point exactly the opposite phase
of the ideal impulse response in Eq.3.8.
As the length of the synthetic aperture and with that also the length of the
signal is limited, it makes sense to limit also the length of the reference function
by a box-like wheighting function  :
:
 |
(16) |
 |
(17) |
The result of the correlation is then
Using that only small values of  are important, the approximation
 can be made. In the following
 ![$FT[\dots]$](img60.gif) should denote
a FOURIER-transform. With this, the correlation result can be written
as
should denote
a FOURIER-transform. With this, the correlation result can be written
as
The result of this correlation is the image. The principal shape of the
resulting impulse response corresponds thereby to the FOURIER-transform
of the weigthing function. Is the weigthing function box-like, as above,
the impulse response is a sinus cardinalis function (sinc or  ).
In Fig. 3.2 this process is illustrated. The received signal,
also called 'chirp', has a constant amplitude and a parabolic phase behaviour
(shown is only the real part of the complex signal). The reference function
has an amplitude of one and exactly the opposite phase than the signal itself.
After the correlation with
).
In Fig. 3.2 this process is illustrated. The received signal,
also called 'chirp', has a constant amplitude and a parabolic phase behaviour
(shown is only the real part of the complex signal). The reference function
has an amplitude of one and exactly the opposite phase than the signal itself.
After the correlation with  the signal appears well located at .
Its maximum amplitude increased from
the signal appears well located at .
Its maximum amplitude increased from  to
to
 and
the peak phase is zero. In reality, the neglected phase term proportional to
the two-way sensor object distance as well as the object phase appear here.
and
the peak phase is zero. In reality, the neglected phase term proportional to
the two-way sensor object distance as well as the object phase appear here.
Figure 3.2:
Signal compression. Real part of the complex signal of
an ideal point target response (left) and amplitude of the
compressed signal (right).
|
|
It can be recognized, that the bigger  gets, i.e. as longer the
syntetic aperture gets, the more
gets, i.e. as longer the
syntetic aperture gets, the more  appears as a DIRAC'S delta
function. Defining the resolution as the half distance between the first
minima of the main peak at
appears as a DIRAC'S delta
function. Defining the resolution as the half distance between the first
minima of the main peak at
 , a synthetic aperture
consequently has an azimuthal resolution of:
, a synthetic aperture
consequently has an azimuthal resolution of:
 |
(26) |
Using the more correct definition of the resolution as the
half width at half maximum, a 14% bigger value is resulting.
The first sidelobes are -13dB lower than the main peak. This can cause
problems, if a strong target is near to some weaker targets. Therefore, instead
of using a box-like weigthing function, often instead other shapes are used,
whose FOURIER-transform shows a better Peak-Sidelobe Ratio (PSLR).
A very common function for this is the so-called HAMMING-weighting:
 |
(27) |
Figure 3.3:
Signal compression using a HAMMING weighting function.
|
|
Choosing  , the first sidelobes of the FOURIER-transform
are completely suppressed (Fig 3.3). The PSLR is now much better
and has a value of only -43dB. Indeed, the height of the maximum is lowered
and also the resolution is main peak is decreased by almost 30%. Despite of
these disadvantages, images processed using a HAMMING-weighting
often appears to be better focused.
, the first sidelobes of the FOURIER-transform
are completely suppressed (Fig 3.3). The PSLR is now much better
and has a value of only -43dB. Indeed, the height of the maximum is lowered
and also the resolution is main peak is decreased by almost 30%. Despite of
these disadvantages, images processed using a HAMMING-weighting
often appears to be better focused.
The process of azimuth focussing, as presented here, is comutationally
very intensiv, as for every single pixel a correlation has to be calculated,
consisting out of a great number of additions and multiplications.
It can be significantly accelerated by utilizing the convolution
theorem [58]:
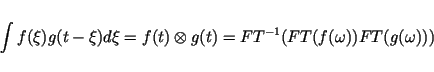 |
(28) |
According to this theorem, the convolution of two functions is equal to the
multipliction of its FOURIER-transforms in the spectral domain.
A correlation represent a convolution with a time-inverted
function [58]:
 |
(29) |
Therefore, the desired compressed signal can also be obtained as in the
following:
![\begin{displaymath}V(t) = FT^{-1}\bigg[ FT\Big[S_A(t)\Big] FT\Big[R(-t)\Big]\bigg] \end{displaymath}](img82.gif) |
(30) |
In practice, the occuring DOPPLER-rates of the signal are dependent
on and are variing with the target distance. It is therfore necessary
to adapt the reference functions to the respective data line under investigation.
Is the correct refernce function calculated, it can be used to focus a
whole azimuth line in one step, using the convolution theorem.
Another problem of the here described, conventional way of processing, are
the signal contributions with higher DOPPLER-rates. They occur under
larger angles and consequently have also a larger time delay. It might happen,
that these signal parts are recorded in later range cells ('Range Cell
Migration'). The echo energy is then distributed over several range line,
and the SAR azimuth focussing process becomes a two-dimensional operation.
A conventional processing whould therefore not be able anymore to focus the
whole energy. In this case more advanced processing methods are necessary,
which are able to take into account this
effect [59]-[63].
In range direction a SAR can work just like a conventional radar. To
achieve a high resolution in the direction perpendicular to the flight direction,
only a short pulse duration  is necessary. In practice, it can
be problematic to generate a very short and high power pulse, as the
resulting energy densities are hard to handle. In the spectral domain,
with short pulse duration a higher signal bandwidth can be observed.
A high resolution is therefore tantamount with a high signal bandwidth.
A second possibilty to generate a high signal bandwidth is to use a long,
but frequency modulated pulse. It is common to use for this a linear
frequency modulation (called 'chirp'):
is necessary. In practice, it can
be problematic to generate a very short and high power pulse, as the
resulting energy densities are hard to handle. In the spectral domain,
with short pulse duration a higher signal bandwidth can be observed.
A high resolution is therefore tantamount with a high signal bandwidth.
A second possibilty to generate a high signal bandwidth is to use a long,
but frequency modulated pulse. It is common to use for this a linear
frequency modulation (called 'chirp'):
 |
(31) |
with  denoting the bandwidth of the emmited pulse. Like in azimuth
this introduces a 'typical' phase history in the signal, which can
later be used to compress the signal. The cirprate
denoting the bandwidth of the emmited pulse. Like in azimuth
this introduces a 'typical' phase history in the signal, which can
later be used to compress the signal. The cirprate  is now
 |
(32) |
In order to compress the extended signal, a new reference function has to
be constructed, which takes into account the typically much faster frequency
variation compared to the azimuth case. The signal compression itself takes part
like part exactly in the same way, i.e. a correllation of the signal with
the new reference functiom has to be calculated. The result is, similar to
Eq. 3.18:
![\begin{displaymath}V_r(t) = A_0\tau\sqrt{2\pi}\exp(i k t^2)
\left[\frac{\sin(k\tau t)}{k\tau t}\right] \end{displaymath}](img87.gif) |
(33) |
The resulting resolution in range direction is:
 |
(34) |
If SAR raw data is processed in azimuth and range, a two-dimensional impulse response
is resulting, which represents the product of the two individual one-dimensional
impulse responses (see Fig.3.4). This function represents the
intensity distribution of a point-like target in the final SAR image.
Figure 3.4:
Two-dimensional point target response (without weighting)
|
|
A SAR processor is the technical realization of the signal compression
in range and azimuth. Its purpose is to derive from the SAR raw data, as
recorded by the sensor, the high resolution image result. Starting from
optical techniques, over analog electronics up to modern digital SAR processors,
several possibilities are existing to realize the necessary computational
steps. Nowadays, in the time of very powerful digital hardware, mostly
digital methods are used, either realized in software or by using
hardware signal-processing.
The principal sequence of processing SAR raw data is shown in Fig. 3.5.
The input is the complex signal, as recorded by the SAR sensor. After
an one-dimensional FOURIER-transform in range direction, each range
line is multiplied with the FOURIER-transform of the reference function
in range. After the inverse FFT back to time domain, the data are
compressed in range, but are still defocused in azimuth. At this point
a correction of the range-cell-migration can happen. Then
a FOURIER-transform in azimuth is performed, followed by a
multiplication of the FOURIER-transform of the reference function
in azimuth. This fuction has to be adapted to the current range distance
under investigation. After the back-transformation, the complex image
result is derived.
In Fig. 3.6 a simple SAR processing scheme is shown, on the basis
of an ideal point target response. I can be observed very good how the
initially defocused signal first is compessed in range and after that
in azimuth direction.
Figure 3.5:
Block-diagram of a simple SAR processor
|
|
Figure 3.6:
Processing of an ideal point target response (no range cell migration)
|
|
Next: Exercise
Up: processing
Previous: Synthetic Apertur Radar
Main level:
Epsilon Nought - Radar Remote Sensing
Andreas Reigber
2001-05-24
![\includegraphics [width=13cm,height=5cm]{signal.epsi}](img72.gif)
![\includegraphics [height=8cm]{sargeo2.eps}](img28.gif)
![$\displaystyle \frac{-2i\sin(kt_{max}t)}{-2ikt} =
t_{max}\left[\frac{\sin(kt_{max}t}{kt_{max}t}\right]$](img65.gif)
![$\displaystyle A_0t_{max}\sqrt{2\pi}\exp(-ikt^2)
\left[\frac{\sin(kt_{max}t)}{kt_{max}t}\right]$](img67.gif)
![\includegraphics [width=12cm,height=5cm]{hamming.epsi}](img78.gif)
![\includegraphics []{2dsig.epsi}](img89.gif)
![\includegraphics []{prozessor.eps}](img90.gif)
![\includegraphics [scale=0.8]{kompress.eps}](img91.gif)