


Next: Other Decompositions and How-to's
Up: How to do a
Previous: Polar Decomposition
Contents
The Cloud decomposition theorem is widely used and a lot of publication about the application of this decomposition can be found in literature. Still, I get a lot of questions how to actually do it. Therefore, here is the ultimate(?) answer to this questions ;o). As said before, this decomposition theorem is based on the coherency matrix. So in a first step we have to form the coherency matrix.
The information contained in the
[S] - matrix can be rewritten into a scattering vector  in terms of the Pauli components.
![$\displaystyle \left[\begin{array}{cc} S_{hh} & S_{\times}\\
S_{\times} & S_{vv...
...in{array}{c} S_{hh}+ S_{vv}\\
S_{hh}-S_{vv} 2 S_{\times} \end{array} \right]$](img508.gif) |
|
|
(B.5) |
By the outer product of this scattering vector and its complex conjugate
transposed vector
 , the coherency matrix [T] is formed.
![$\displaystyle \left<\left[ T \right]\right> = \left<\vec{s}\vec{s}^{\dagger}\right>$](img510.gif) |
|
|
(B.6) |
where
 denotes a spatial ensemble averaging
assuming homogeneity of the random scattering medium.
Please make sure, that you first compute the matrix and then do the averaging. One of the most common errors is to average first over the scattering vector and then to compute the matrix. If you haven't already made that error, try it out and see the result ;o). Instead of averaging over all pixels in the neighborhood it is usually preferable to use a filter like the Lee filter [Lee97]. An IDL implementation of the filter can be found on http://epsilon.nought.de. If you don't use the filter but a ordinary boxcar/sliding window averaging, you have to keep in mind, that the size of the filter box affects your result. A small box will result in a quite noisy image while a large box will lead to a more homogenous image but will decrease your resolution and eventually erase small or line like structures. An optimal size for the box is a question of what you want. Therefore, it's trial and error. A little tip from my side. If you use single look complex (SLC) data, the resolution in azimuth is usually better than in range. Therfore, a rectangular box instead of a square one might be worth an idea.
denotes a spatial ensemble averaging
assuming homogeneity of the random scattering medium.
Please make sure, that you first compute the matrix and then do the averaging. One of the most common errors is to average first over the scattering vector and then to compute the matrix. If you haven't already made that error, try it out and see the result ;o). Instead of averaging over all pixels in the neighborhood it is usually preferable to use a filter like the Lee filter [Lee97]. An IDL implementation of the filter can be found on http://epsilon.nought.de. If you don't use the filter but a ordinary boxcar/sliding window averaging, you have to keep in mind, that the size of the filter box affects your result. A small box will result in a quite noisy image while a large box will lead to a more homogenous image but will decrease your resolution and eventually erase small or line like structures. An optimal size for the box is a question of what you want. Therefore, it's trial and error. A little tip from my side. If you use single look complex (SLC) data, the resolution in azimuth is usually better than in range. Therfore, a rectangular box instead of a square one might be worth an idea.
Unlike the Kennaugh power reflection matrix the coherency matrix allows
for eigenvalue analysis, and [T] can therefore be expressed as
![$\displaystyle [T] =
\lambda_1 (\vec{e}_1 \vec{e}_1^\dagger) +
\lambda_2 (\vec{e}_2 \vec{e}_2^\dagger) +
\lambda_3 (\vec{e}_3 \vec{e}_3^\dagger)$](img511.gif) |
|
|
(B.7) |
where  are the eigenvalues and
  are the corresponding eigenvectors of [T]. This is a crucial step for this decomposition approach, since - depending on your implementation, programming language, and computer system, the calculation of the eigenvalues and vectors for a scene can take any time between some minutes and some hours. Therefore, if you want to speed up your process, here is the point to look for.
There are a couple of libraries on the web. Depending on your preferred programming language you might find some efficient solutions.
are the corresponding eigenvectors of [T]. This is a crucial step for this decomposition approach, since - depending on your implementation, programming language, and computer system, the calculation of the eigenvalues and vectors for a scene can take any time between some minutes and some hours. Therefore, if you want to speed up your process, here is the point to look for.
There are a couple of libraries on the web. Depending on your preferred programming language you might find some efficient solutions.
In the following we will denote the eigenvalues (and corresponding eigenvectors) in a way that
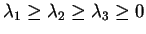 . The coherence matrix is by definition hermitian positive semi definite, which is a pretty cool expression isn't it. It is well suited to impress your friends as long as you don't tell them that this only means that your eigenvalues are real and greater or equal zero. O.k. since the coherence matrix is by definition hermitian positive semi definite (sorry couldn't resist) here is the next point to check if your algorithm goes bananas or not. If your eigenvalues are not real and not greater equal zero you are bound for a big surprise at the end of your program. The eigenvalues and eigenvectors can be interpreted as follows: The eigenvectors contain information about the type of scattering while the eigenvalues yield information about how much the scattering process described by the corresponding eigenvector contributes to the whole scattering process. Of course, there can be more than 3 scattering processes in one resolution cell but since we work with a 3
  3 matrix, 3 eigenvalues and three eigenvectors is all you get. (here again you see that 5 is the maximum number of independent parameters, 3 eigenvalues and 2 scattering mechanisms. Since the mechanisms have to be orthogonal to be separable you can 'choose' one free, that leaves you with a 2D subspace from which you can choose the second and the 3rd is left with a one dimensional subspace an is dependent on the selection of the first two.
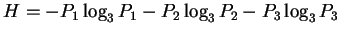
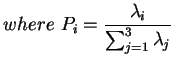
O.k. once we have our eigenvalues and vectors we can start to calculate the entropy H and the rest of the parameters you want.
From the eigenvalues  , the entropy H and anisotropy A, can be derived,
 |
|
|
(B.8) |
 |
|
|
|
 |
|
|
(B.9) |
 provides information about the
number of involved scattering processes
This means an entropy H of Zero denotes a pure deterministic scattering process.
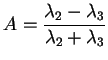
The scattering in your resolution cell is dominated by one pure scattering process (e.g. for a trihedral corner reflector your entropy should always be Zero otherwise something is fishy). An entropy H = 1, on the other hand tells you that all 3 scattering processes contribute in the same way to the scattering process. The second parameter derived from the eigenvalues, the anisotropy
provides information about the
number of involved scattering processes
This means an entropy H of Zero denotes a pure deterministic scattering process.
The scattering in your resolution cell is dominated by one pure scattering process (e.g. for a trihedral corner reflector your entropy should always be Zero otherwise something is fishy). An entropy H = 1, on the other hand tells you that all 3 scattering processes contribute in the same way to the scattering process. The second parameter derived from the eigenvalues, the anisotropy  yields
the normalized relation between the minor eigenvalues, and therefore,
information about the relation between the 2 less dominant scattering mechanisms.
From the eigenvectors. In the extreme cases of H = 1 or H = 0 the anisotropy is zero but for the mid range of the entropy the anisotropy can yield helpful information.
yields
the normalized relation between the minor eigenvalues, and therefore,
information about the relation between the 2 less dominant scattering mechanisms.
From the eigenvectors. In the extreme cases of H = 1 or H = 0 the anisotropy is zero but for the mid range of the entropy the anisotropy can yield helpful information.
From the eigenvectors
![$\displaystyle \vec{e}_i = \left[ \begin{array}{ccc} \cos \alpha_i e^{i\phi_i} \...
...^{i\delta_i} \sin \alpha_i \sin \beta_i e^{i\gamma_i} \end{array} \right]$](img520.gif) |
(B.10) |
the
 - angle can be derived
 |
(B.11) |
which is related to the type of scattering, and can be interpreted as shown before.
With the entropy H and the
- angle we can form a two dimensional feature space where each pixel can be assigned to a certain scattering behavior.
an interpretation of this space was provided by Cloude and Pottier [Cloude99a] as shown in Fig. B.1
Figure:
Entropy H -
- angle feature space
|
|
Please note that the
- angle is an averaged value and denotes a mean scattering mechanism. This can sometimes be misleading, if used without caution.
If you find in in the same resolution cell a double bounce scattering mechanism as well as a surface. For example, in a data set with a low resolution a house wall and the road in front may be covered by the same resolution cell (pixel). Therefore, we will find in this resolution cell a surface (single bounce from the road) with  = 0
= 0 as well as a double bounce (road - house wall) with = 90. If both contribute in the same way to the scattering process,
will equal = 45 denoting a dipole like scattering. Even if the only thing you will not find there is a dipole. So watch out or you will be wiped out (Prof. Martin Wolfgang Boerners famous words at the PIERS workshop in Baveno 1998). ;o)
as well as a double bounce (road - house wall) with = 90. If both contribute in the same way to the scattering process,
will equal = 45 denoting a dipole like scattering. Even if the only thing you will not find there is a dipole. So watch out or you will be wiped out (Prof. Martin Wolfgang Boerners famous words at the PIERS workshop in Baveno 1998). ;o)
Last but not least the signal to noise ratio (SNR) one of the probably most common erros in the analysis of polarimetric radar data is to analyze a signal where you actually have no or nearly no signal. Since most of the radar remote sensing systems are side looking systems the geometry plays an important role in the analysis of the data. In some areas you might get a pretty poor signal to noise ratio. For example in shadow regions behind forests, buildings, mountains etc. you get a very weak backscatter intensity. Also over smooth good reflecting surfaces the most part of the signal is reflected away from the sensor. Such areas in your data will usually appear very dark and have a very poor signal to noise ration. In such cases the application of polarimetric techniques will evaluate rather the noise (which is in general not polarized) than the signal from the ground. So if your a lake in your scene shows a volume like scattering it's quite likely that this is effect of the background and system noise rather than scattering phenomenon arising from the lakes scattering behavior.
Next: Other Decompositions and How-to's
Up: How to do a
Previous: Polar Decomposition
Contents
![\includegraphics[width=14cm]{diss_h_alpha_shane.eps}](img378.gif)